

Tools
Server Utilization Monitoring
Epicode provides a server utilization monitoring dashboard that enables real-time visibility into infrastructure resource usage, especially during high-volume calling operations.
For deployments handling large call volumes or running on dedicated infrastructure, the Epicode team will provide access to this monitoring platform. The dashboard helps customers track server health, resource consumption, and overall system performance to ensure optimal operation.
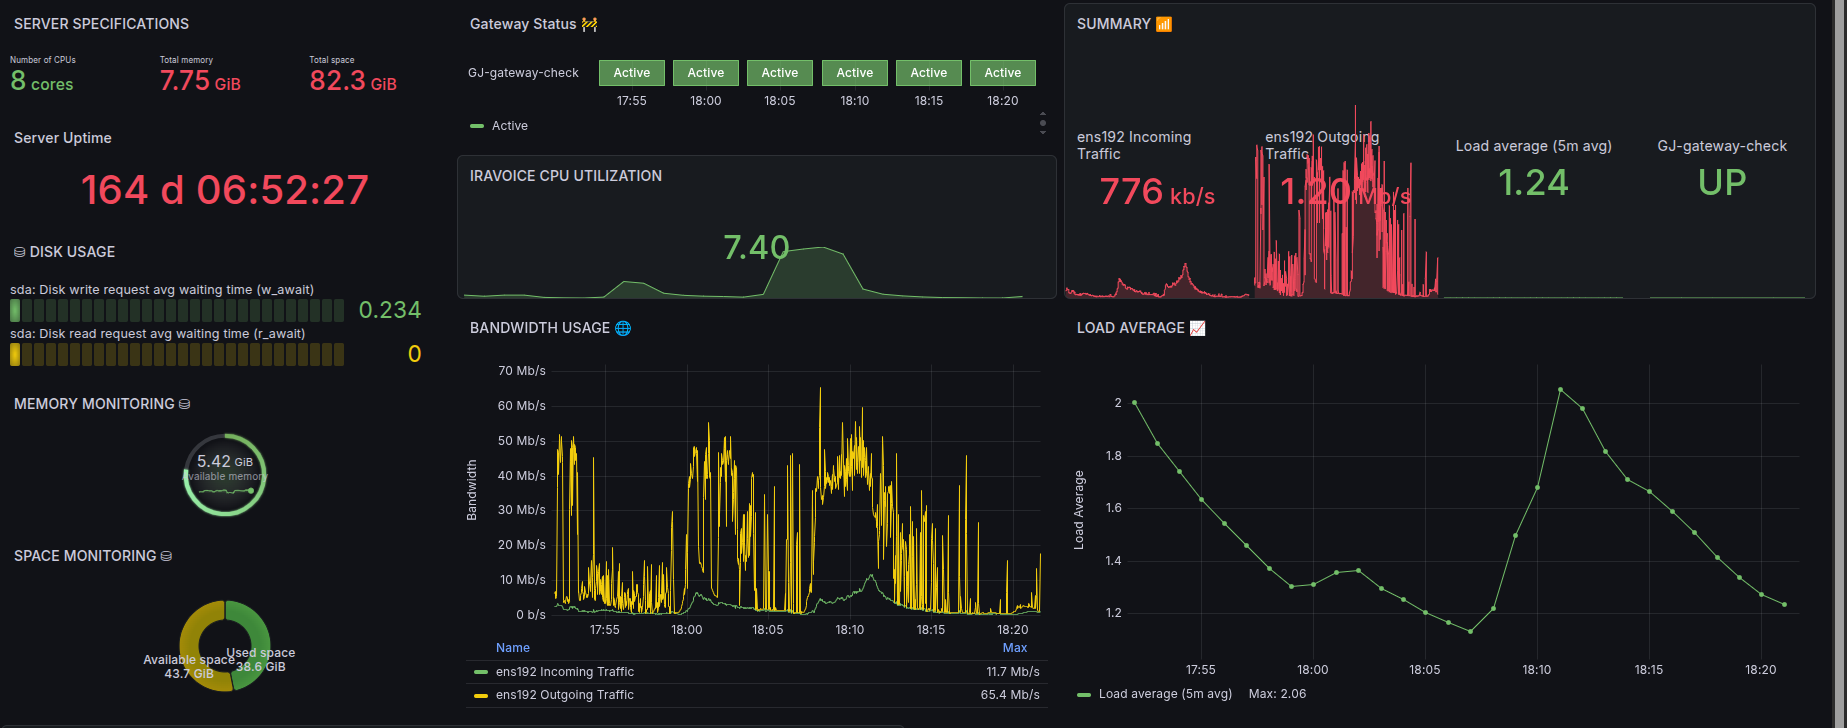
The monitoring dashboard includes:
- Server Specifications – CPU, memory, storage, and network configuration details.
- Server Uptime – Current uptime and system availability information.
- Gateway Status – Health and connectivity status of configured SIP gateways.
- Load Average – Real-time server load metrics to assess CPU utilization.
- Memory Monitoring – Detailed RAM usage, available memory, and consumption trends.
- Storage Monitoring – Disk utilization, available space, and storage health.
- Bandwidth Usage – Network traffic statistics, including inbound and outbound throughput.
- System Health Metrics – Additional infrastructure metrics and alerts for proactive monitoring.
Last modified on